

Our visual analytics platform is transforming the way organization use data to solve problems. RevalMaps helps business of all sizes, see and understand data visually.
Our visual analytics platform is transforming the way organization use data to solve problems. RevalMaps helps business of all sizes, see and understand data visually.
Features
Features that make this Simple & Possible
Features that make this Simple & Possible
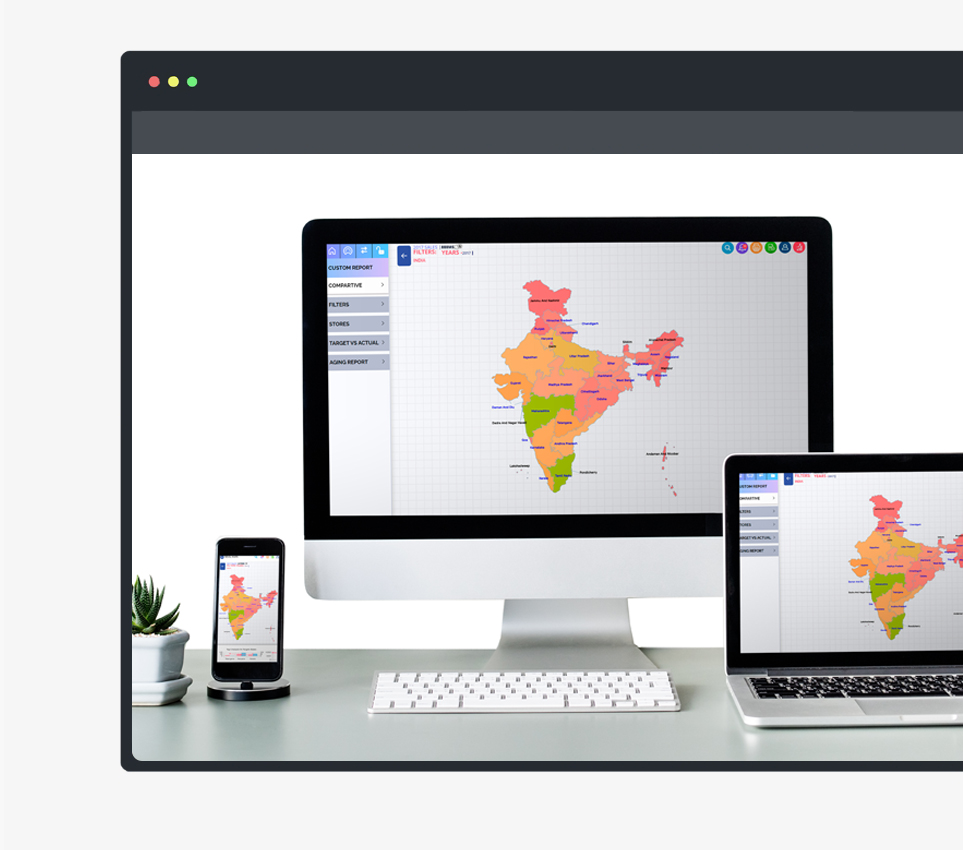
All devices welcome
On desktop devices, tablets, or smartphones — RevalMaps visualizations are beautiful and readable everywhere.
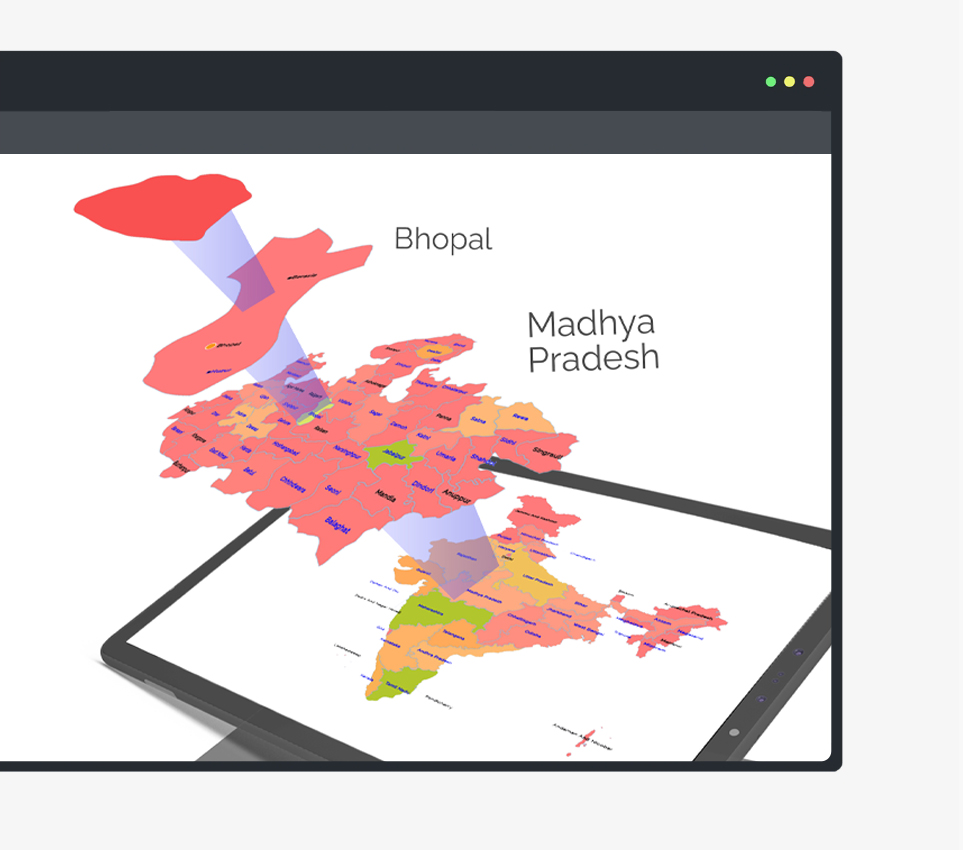
Indian Map with more depth
Covered every state & Pin code to show very detailed view of Insights.
Personalize your maps
Customize maps with unique symbols, colors, and basemaps for personalization.

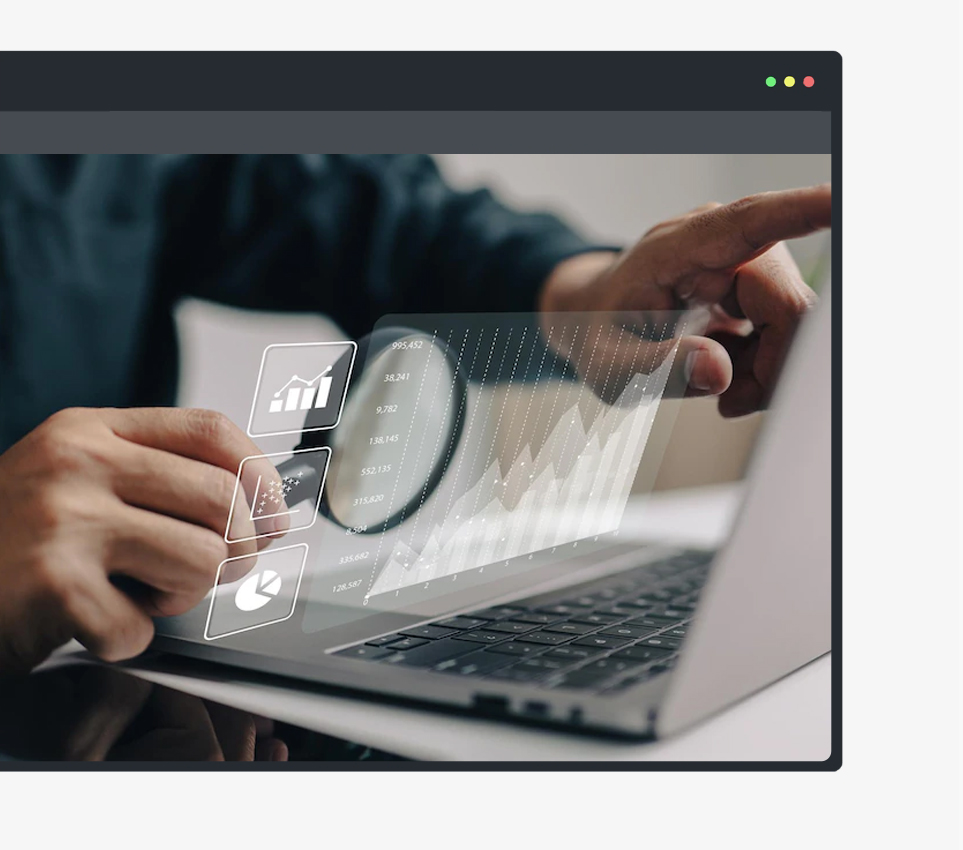
Compare Data
Compare several time range / any data elements /metrics
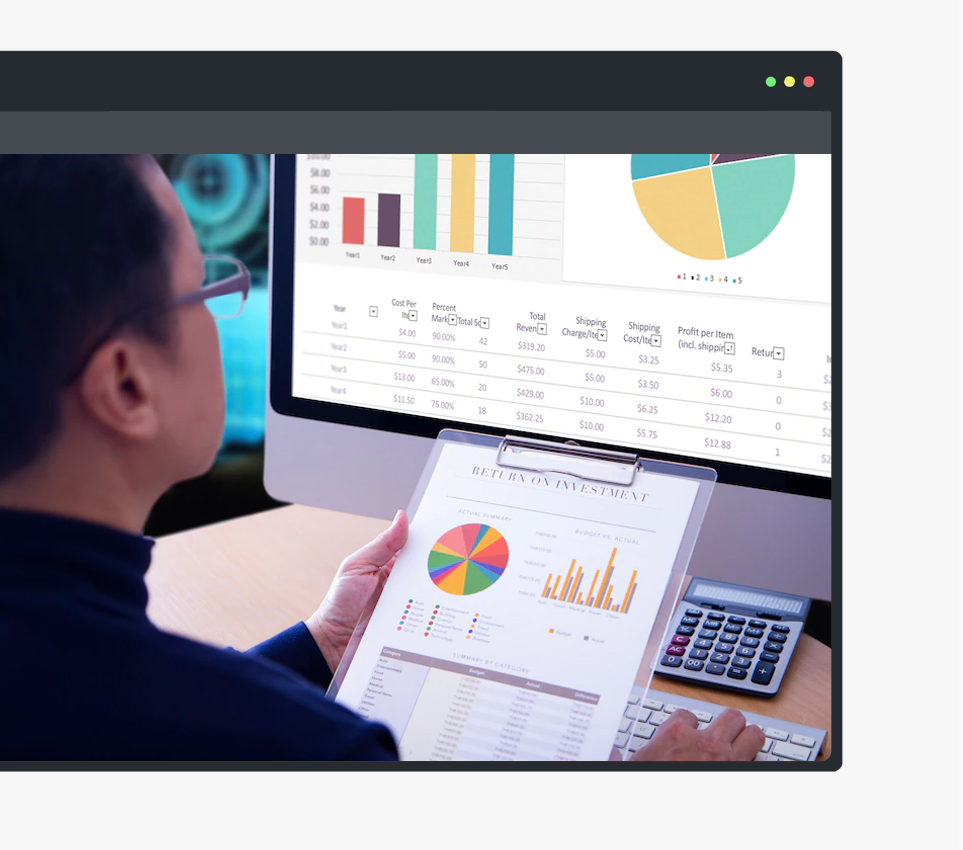
Data in, magic out
Import a spreadsheet, link to real-time data, or integrate via API.

Editor workflows
Enable open publishing or enforce editorial review for submissions.
Flexible deployments
On premises or On the cloud

Simplify report viewing
Effortlessly visualize your data with a single click in MAP view.

